In order for a company to make effective and intelligent decisions, it needs to be able to visualize data. Data visualization is the process of representing data in a graphical format so that it is easier to understand. When data is visualized, it can be quickly processed and understood, which allows for faster and more accurate decision-making.
Charts are a great way to visualize data, and they can be used in a variety of business contexts. There are several types of charts for your company to take advantage of, including radar charts. If you want to know more about radar charts and why use a radar chart in your company, continue reading.
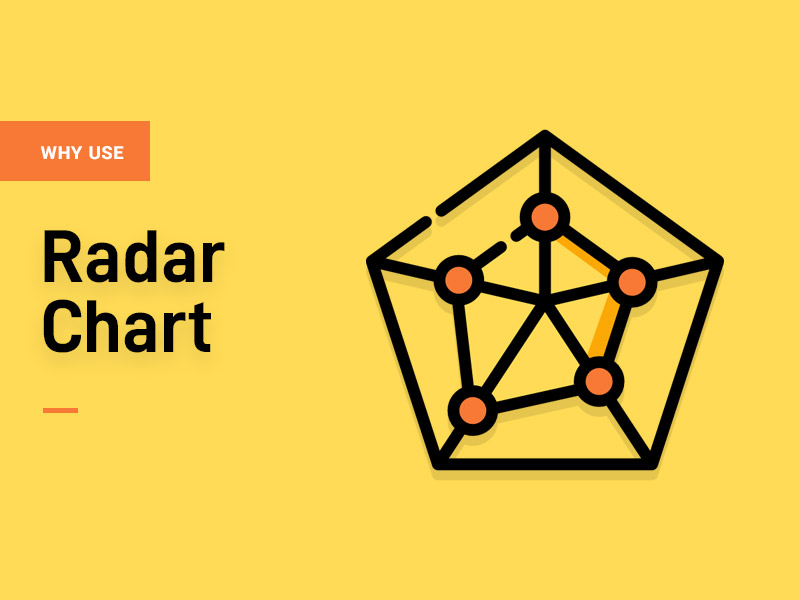
What is a radar chart?

A radar chart, also called a spider chart, is a graphical tool used to display the relative proportions of different values in a data set. A radar chart is made up of a series of concentric circles, with each circle representing a data point. The size of the circle is proportional to the value of the data point, and the position of the circle is proportional to the value’s relative position in the data set.
There are a few general tips that can help you create an effective radar chart. First, start by identifying the categories you want to compare. Then, choose the right type of data. Radar charts work best when the data is in a radial format, meaning that the data is arranged around a central point. For example, you can use a radar chart to compare the sales of different products in different regions or the budget allocations for different departments. Next, format the data correctly. The data should be arranged in a table, with one column for each category and one row for each data point. The data should then be entered into the chart in the same order.
Then, once you have the data in the correct format, you can start creating the radar chart. First, draw a circle in the center of the page and then draw spokes radiating out from the center. Next, label the categories on the spokes and then enter the data points into the chart. You can use colors and symbols to emphasize the data. For example, you can use different colors to represent the different categories, or you can use symbols to represent the data points. Finally, each category and data point should be labeled with the value it represents.
Why should your company use radar charts?

There are many reasons why you might want to use a radar chart in your company. Perhaps you want to track the progress of your team or individual employees over time. Maybe you want to track customer satisfaction or other key performance indicators. Radar charts are often used to compare different items or values, and they can be helpful for business because they can easily show how one value compares to others. This can be especially useful when trying to determine how a company is performing compared to others in its industry. Additionally, radar charts can be used to track progress over time or to identify areas of improvement. For example, you can use a radar chart to compare the sales figures of different products in your company.
Radar charts can help improve the product development cycle by quickly and easily displaying the relationships between different data points. This can help teams better understand how different aspects of the product are related and how they can be improved. Additionally, radar charts can help identify potential problems early on in the product development cycle, allowing teams to address them before they become bigger issues.
Radar charts can also identify patterns in customer feedback and how different factors are related to one another. This makes it easy to see what customers like and don’t like about your product or service. You can use radar charts to track customer satisfaction over time or compare customer feedback from different groups of customers. Spotting trends in your customer feedback can help you make decisions about how to improve your product or service.
Data visualization is crucial to gaining the most effective insights into your company’s operations. To gain a deeper understanding of your company’s performance, you will want to take full advantage of all radar charts can offer.
Recommended: Free Organizational Chart Templates for Microsoft Word