Looking for free infographic makers or creator tool to create inforgraphics online?
Like us, majority of the readers want to digest brief information in a quick and easy way. For this you can’t rely upon text-content only. For even maximum engagement, we need to convert our words and ideas into visual graphs.
And, if done correctly, an infographic can be a great way to present and digest your complex data or information to the users in only a few seconds.
Graphic design is my passion and infograhic is a popular subject, covering lengthy blog posts with interesting informational facts and stunning graphics. Even they are easier to share on social media and other infograhic submission websites for generating backlinks & traffic.
What is an Infographic?
An infographic is a combination of the words information and graphics, or an infographic is a chart diagram/illustration that uses graphic elements to present information visually.
According to Oxford, the dictionary defines infographics as information or data shown in a chart or diagram to easy to understand.
So, in a nutshell, infographics bring together the best data and visuals to craft a story or convey an idea more cohesively.
Types of Infographics
There are so many different types of infographics that you can create with free infographic makers.
Statistical Infographics
The statistical infographic tell the story behind your data. They use various data visualizations such as pie chart, bar graphs, line chart, pictographs, maps, etc. This type of infographics use to visualize survey results, essential statistics from a report or a topic.
Informational Infographics
This type of infographics present new or specialized data on a topic like a blog post or a report. The infographics are a pretty straightforward way to use descriptive headlines with supporting points and small visuals.
Timeline Infographics
A timeline infographic visualize information over time. Usually, this type of infographics has a timeline with different dates and events branches. You can use icons, photos, labels etc., to highlight and explain a point in time.
Process Infographics
A process infographic is used to help those who aren’t following instructions or steps. This type of infographic provides an overview and an explanation of the steps involved in a process. Most of the process infographics follow a simple layout with numbered steps with a brief description below and illustration.
Geographic Infographics
In a geographic infographic, you can use maps to visualize population information or location-based information. This type of infographics is used to break down a population by demographics.
Comparison Infographics
Typically, this type of infographic has a line in the middle with one option on each side. It makes it easier for readers to compare two different things, products, services, etc.
Hierarchical Infographics
This infographic helps you to visualize hierarchies or organizations. This type of infographics is similar to a flowchart. We use a hierarchical infographic to display the chain or branches of a company or a product.
List Infographics
We use a list infographic to share a collection of tips or a list of resources. A goal of a list infographic is to make points or a list interesting.
Resume Infographics
A infographic resume gives a better impression to the interviewer than a simple word information resume. In resume infographics, you can create an eye-catching header that reflects your personality and use charts, pictographs, bar graphs to visualize your skills levels.
So now you have nine types of infographics that you can create according to your information or data.
What Makes an Effective Infographic?
We live in an internet age where fact-checking is easier than ever, so be sure that all the information in your infographic is correct and honest. If you provide figures from somewhere else, then provide a source of that information.
It would be best if you prioritized fonts that are simple and easy to read. Avoid making your infographic too busy. Try to make the design or style minimalist and straightforward.
Also, make illustrations simple and ensure that they complement the data being conveyed in the infographic. The complex graphics can distract your audience from important information in your infographic.
Use limited colours or use a colour palette to create a visually appealing infographic.
Benefits of Infographic in SEO
There is no doubt that infographic submission is the easiest and best way to earn high-quality backlinks from well-established platforms.
An infographic is made of visual images like diagrams or charts representing complex data or information quickly and easier to consume by the users of every level.
When done correctly, they can become an excellent source for generating quality traffic and engage viewers. In fact, with a remarkable and valuable infographic, you can attract a high number of particular users to your website.
A false belief is being created regarding the infographics that they don’t have any SEO value. Though it’s correct that search engines can’t recognize the content in your infographics, but the audience can. People can also opt for other seo techniques like niche edits. Visit https://serpreach.com/niche-edit-service/ for more information.
An infographic can beneficial for an SEO campaign if it’s shared rightly because the essential aspect of SEO is having a significant number of quality sources of inbound links that direct users to your website. And infographics can make such an effort efficiently.
Also, below are the three major benefits to create infograhics:
- Provide five times more information.
- Users are 80% more eager to read anything with colors.
- 45% readers will click on the link featured into infographic.
- We get valuable inbound links through infograhics.
How to Publish an Infographic?
Write a blog post on the same topic that you’re talking about in your infographic. Your blog post should be SEO friendly so that the post will be easy to find by search engines. This is the easiest way to publish an infographic online.
Also, there are infographic submission websites where you can share your design. This will help your infographic quickly share and spread worldwide with an enormous reach while also gaining SEO benefits such as social signals and backlinks.
Infographic Submission Sites List
An infographic gets viral by nature or by reaching a vast audience, which can be possible through submission on top infographic sites, directories, or guest post blogs.
But again, your infographic should be valuable and helpful to create a symbiotic relationship and assist both you, visitors, and the owner of that source.
The internet is full of infographic submission websites, but it would be hard to find some best or high PR sources.
Hence, I have over 20 websites that showcase infographics on their site, Now use these platforms for submission and get the most exposure, backlinks, and traffic to your website or infographic.
- flickr.com
- pinterest.com
- visual.ly
- slideshare.net
- infographicsshowcase.com
- reddit.com/r/infographics
- infographaholic.tumblr.com
- dailystatistic.com
- bestinfographics.info
- infographicportal.com
- infographicsinspiration.com/infographic-submissions
- allinfographics.org
- datavisualizations.tumblr.com
- elearninginfographics.com
- infographic-directory.com
- bestinfographics.co
- infographicjournal.com
- infographicplaza.com
- amazinginfographics.com
- visulattic.com
- infographic.ca
How to Make an Infographic Online for Free?
Ready to make beautiful and engaging infographics? Maybe with these words, you will be excited and want to start to create your infographic with free infographic makers. However, it would not possibly come into the search results or get the attention it deserves if you make it.
Simple answer…
Your infographic should be informative and engaging!
As we know, users want to read all lengthy information in a quick and easy way. Learn some easy graphic design tips and start creating your infographic with online tools. An infographic creator is also short on time with their project and need an easier, faster way to create attractive infographics in minutes?
Best Free Infographic Makers to create from Scratch
So it will be good to use infographic maker here besides photoshop’s time-consuming process. Here we have the best free infographic makers online tools available online to create own infographics in no time.
Let’s take a look…
DocHipo – Free Online Infographic Maker
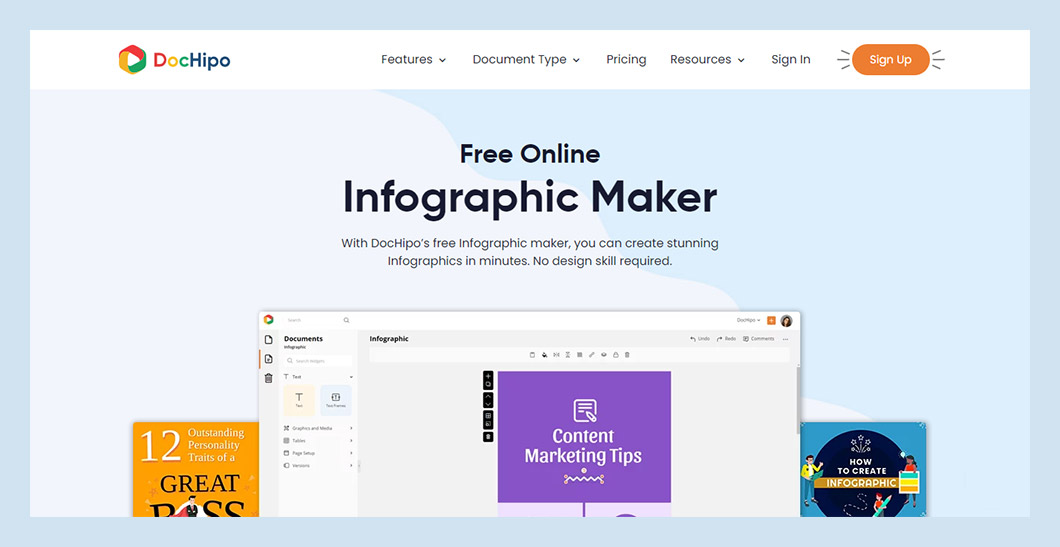
DocHipo helps you create stunning infographics in minutes. Designing infographics is as easy as 1-2-3 using DocHipo.
Step-1: Choose from a wide variety of beautifully designed infographic templates.
Step-2: Once you have selected a template, customize it using DocHipo’s intuitive drag-and-drop editor. Change the color, tailor the message, use beautiful illustrations, stickers, animations, and other design assets to create a stunning infographic.
Step-3: Once you are ready with the design, download or publish them on your favorite social channels right from DocHipo itself.
Sign up to DocHipo for free and translate your ideas into beautiful infographics all by yourself.
Canva – Best Free Infographic Maker
Canva is an easy to use and powerful online inforaphic creator tool suitable for all aspects of designing from brochure to a presentation and even more for things. In addition, users have access to a huge library of icons, images, fonts etc. and can also upload your own images.
Snappa
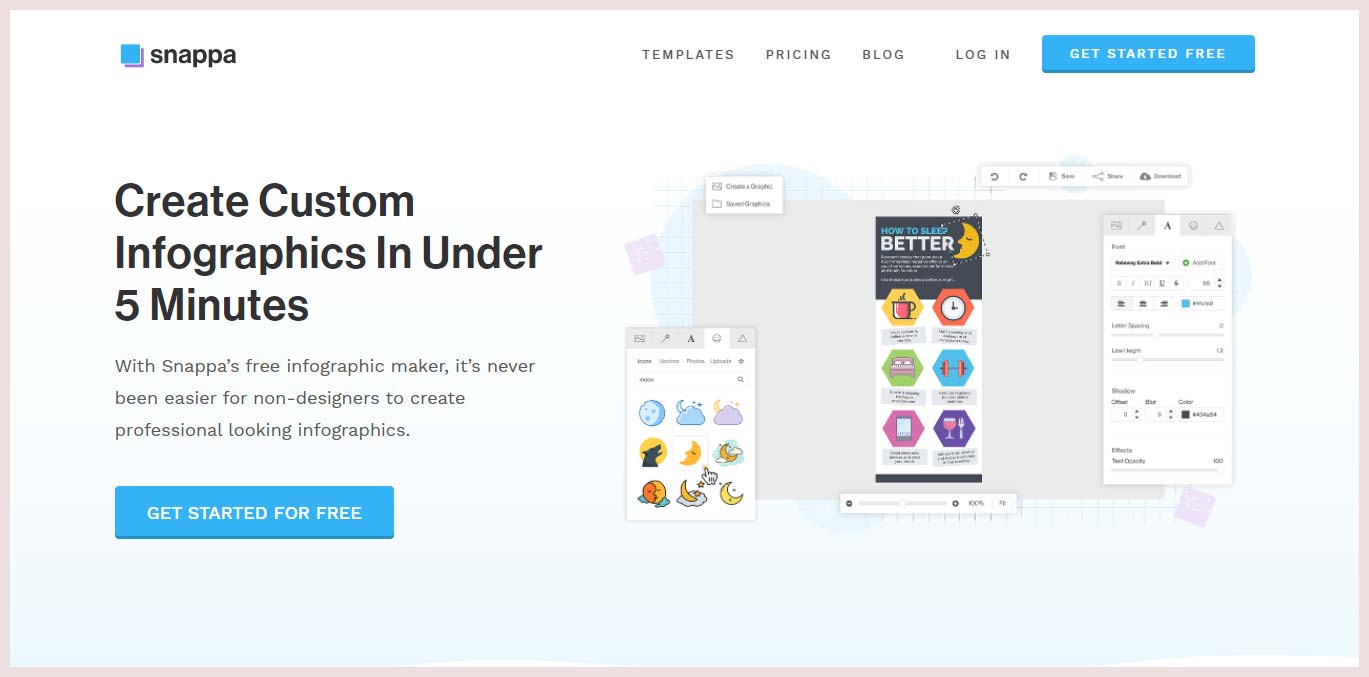
You can use Snappa for free infographic to create high appealing infographic design. It is an effortless graphic design online software. There are thousands of templates available. It would be best if you edited the same according to your information.
Crello – UX-Friendly Infographic Designer
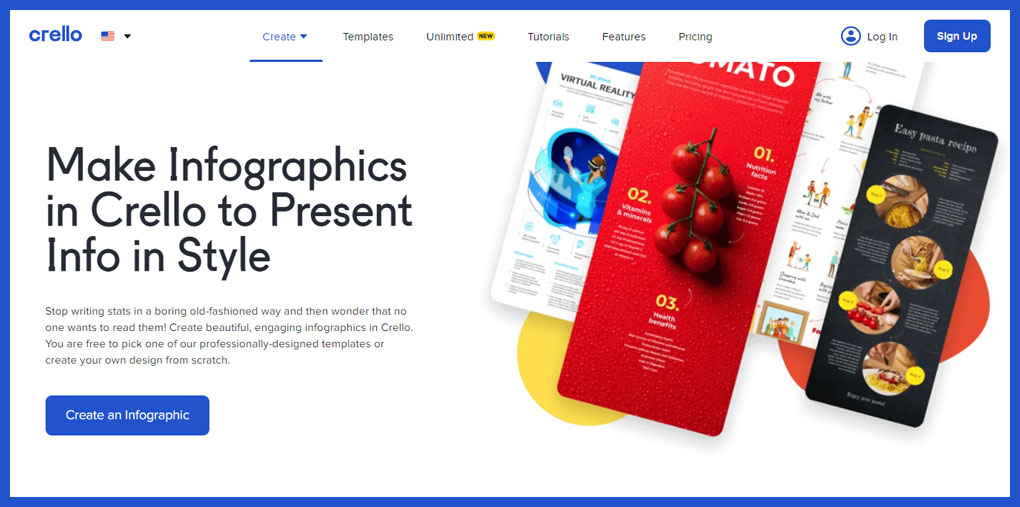
Crello is a free online design tool allowing you to browse dozens of professional pre-designed infographic templates and customize them to your needs. It also gives access to their media library of premium photos, videos, graphics, and animated design so you could create impressive infographics and other visual content in minutes.
Piktochart – Create Easy Infographics
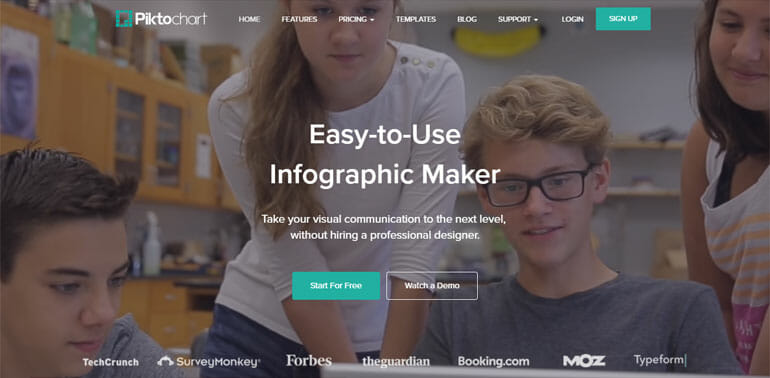
Piktochart is an infographic creator fit for presentation and can turns boring data into charming infographic in no time with few clicks. It also offers user a vast collection of animated charts using icons, themes, text frames and as well use of own photos or videos.
Visme – Free Infographic Tool
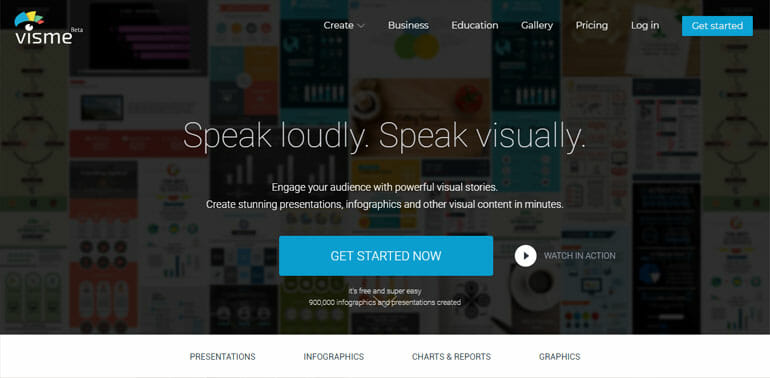
Visme is a great infographic maker to design infographics, interactive presentations, ad banners, customer layouts, animations and much more. Not only that, it also has a wide full set of shapes, templates, icons and objects to pick.
Infogram – Simple Inforgraphics Creator
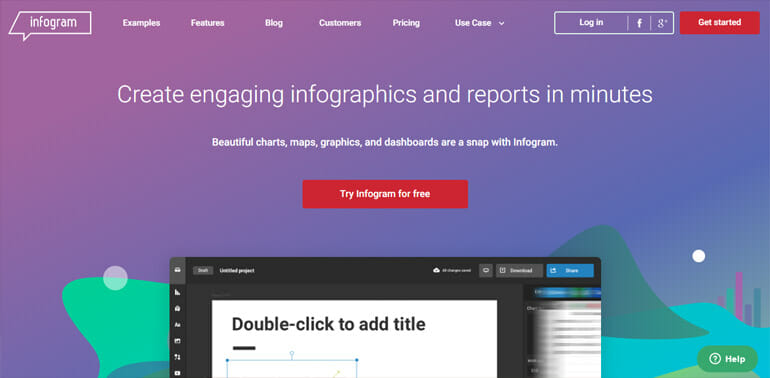
What profession your is blogger, brand ambassador, educationalist or an organization, With Infogram its simple to create infographics or charts in three steps: pick a template, visualize the data, and publish.
Venngage – Free Infographic Maker
Venngage Infographic Maker has all tools needed to create infographics and publish them instantly. It is fully responsive suitable for all devices from iPhones to desktops with hundreds of professional templates.
Easel.ly – Create and share visual ideas
Easel.ly is next in our best free infographic makers list. It’s an infograhic creator having about millions free stock photos and templates to create free infographic. For any help you can alsocontact their designers or roam webinar to get design inspiration.
EDIT.org – Infographic maker for small businesses
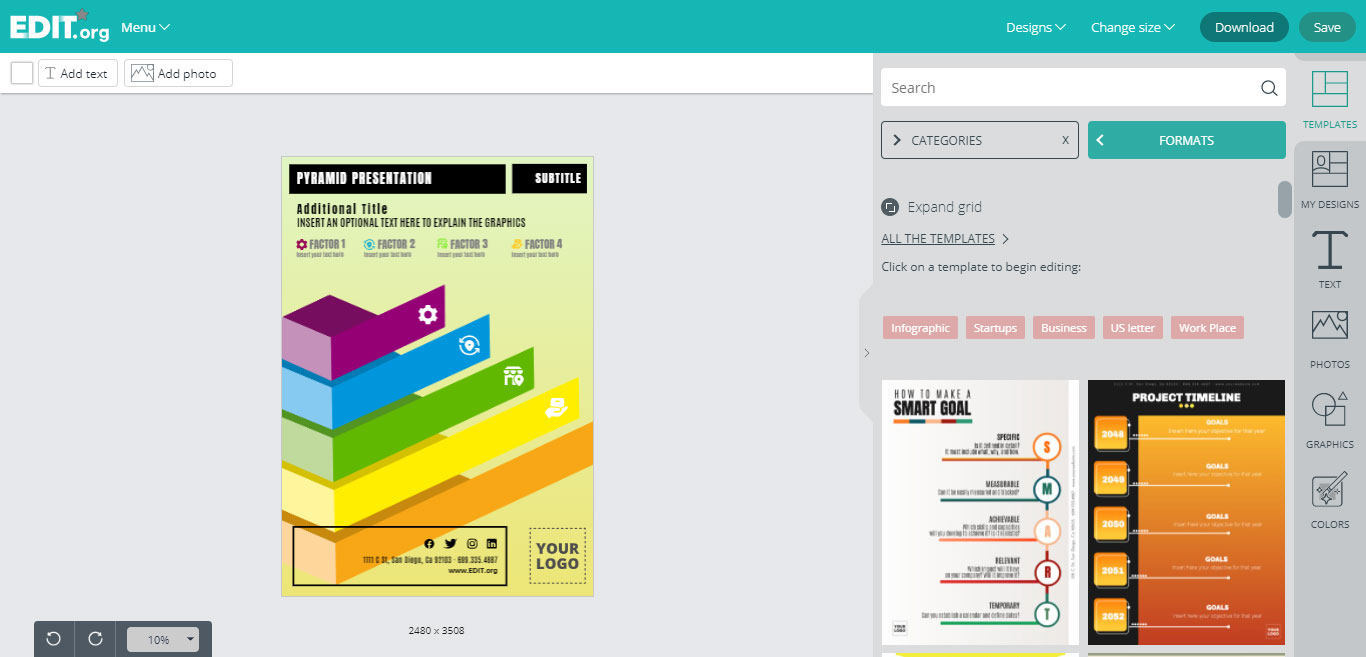
This editor offers the possibility to create different types of detailed infographics (maps, timelines, lists, flowcharts, comparisons, data visualization articles, etc.) with free customizable templates. Unlike other online design tools, EDIT.org focuses on small businesses and projects, so its templates are designed to meet the needs of these companies. You can edit these templates easily and in a few minutes, and you will always get a detailed and professional result. On the editor, you can save your designs in the user profile to create copies or keep editing them later, as well as share them with your team when necessary.
Mind the Graph – Infographic Maker
Dedicated to the students infographic creator platform, Mind the Graph provides scientific design graphs and charts. You can also customize infographics or usereal-time help feature.
Icograms – 3D Map Designer

As per now Icograms on beta stage, however, it really has some great 3D infographic maker tools to create maps, charts, isometric illustration and diagrams using in-built templates or icons and also upload your own graphics.
Vizualize.me – Visualize your resume
Vizualize.me – Infographic maker website dedicated to create infographic resumes but not limited with that, it also has stunning and effective designed templates which can fulfill your expectations.
Google Charts
A free infographic creator by Google with all types of maps, bars, charts and statistical graphs with variety of collection but little training require using perfectly.
Cacoo – Online Diagram and Flowchart Software
Cacoo is a user-friendly and free infographic creator tool allows users to create a range of diagrams including wireframes, UML, sitemaps, and network charts.
Kinzaa – Visually stunning infographic resumes
Kinzaa is an infographic creator platform that let you create infographic resumes and stunning landing pages for websites.
Adioma – Infographic Maker with Timelines
With a smart AI (learn from usage) Adioma is an online infographic creator tool that automatically detects and create the infographics based on your provided information.
Edraw – Infographic Software
Edraw is a graphic design software designed for Mac, Windows and Linux systems to build maps and charts. It’s fully customizable with sets of tools, lots of built-in icons and ready-to-use templates. Drag and drop infographic charts and maps and modify every element to your own requirements easily.
Creately
Creately is an infograhic maker tool to create and style over 50 different type diagrams, smart shapes and much more. It also act as a real-time collaboration platform to create perfect designs.
InFoto App
InFoto is a photo stats analyzer for Android to create infographics with your images, Using it you can build high-res infographics related to your photos based on dates & time, places and other data which includes shutter speed, ISO, camera orientation and more.
Fiverr – For non-designers
 If you are not good at designing and can’t use above free infographic makers or don’t have time to invest in creating infographics, then another solution helps you a lot. Sign up for Fiverr.com and get hired someone to design an infographic for you.
Fiverr is would’s best marketplace to find the best freelancers at meagre rates (Starting from $5.00 only). As I said, your infographic should be engaging, so I don’t think $5 investment will increase your weekly expenses.
Conclusion
With wrapping my words, I hope these free infographic makers or creator tools will help you to create your own creative and unique infographic.
What are some of the tools that you use to create infographics or did I miss your favorite one? I would like to learn about your workflow.
If you think, there is any best infographic submission website that we missed… Please share the link in the comments section. Also, please share your experience with our audience about infographic submissions. Please appreciate my efforts by sharing this article if you like it.